

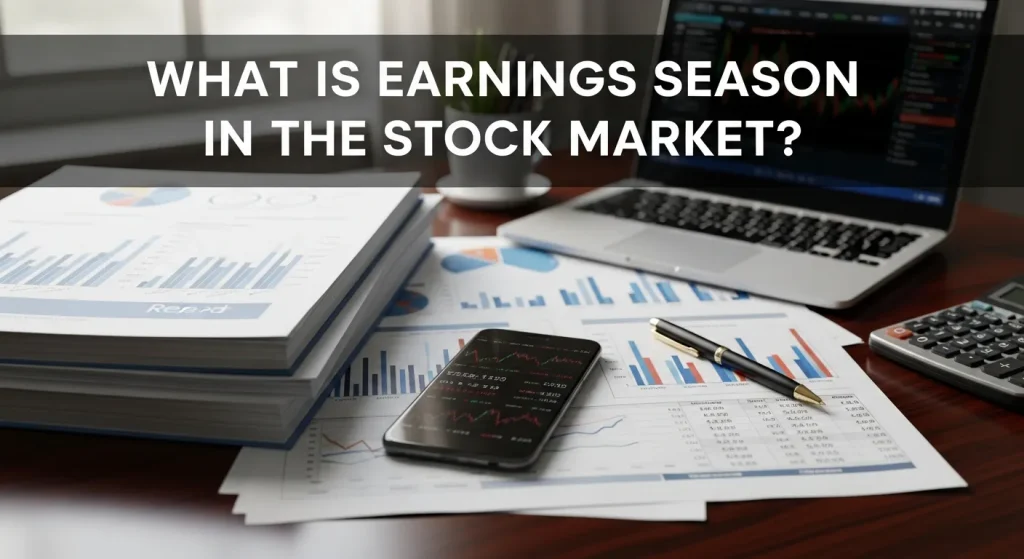
Every quarter, Wall Street buzzes with anticipation as public companies release their financial scorecards. Understanding earnings season in the stock market is crucial for anyone looking to navigate price volatility and identify long-term growth opportunities. This guide breaks down exactly how to capitalize on these critical four-week periods.
This comprehensive guide demystifies earnings season, explaining its impact on stock prices and investor sentiment. We cover how to read earnings reports, interpret guidance, and use data to refine your portfolio strategy. You will gain actionable insights on handling volatility, analyzing key metrics like EPS and revenue, and avoiding common pitfalls. By the end, you will have a clear framework for making data-driven decisions during the market’s busiest times.
The Mechanics of Earnings Season
Earnings season in the stock market refers to the months when the majority of publicly traded companies release their quarterly financial reports. These periods typically begin one to two weeks after the end of each quarter (January, April, July, and October). While companies operate on different fiscal calendars, the vast majority align their reporting with the calendar year.
Why does this matter? Because information moves markets. During these weeks, the market is flooded with data regarding corporate health, consumer demand, and future economic outlooks. This influx of information often leads to significant price swings, presenting both risks and opportunities for investors.
The Quarterly Cycle
- Q1 Earnings: Released in April (reflecting Jan-Mar performance).
- Q2 Earnings: Released in July (reflecting Apr-Jun performance).
- Q3 Earnings: Released in October (reflecting Jul-Sep performance).
- Q4 Earnings: Released in January (reflecting Oct-Dec performance).
The season unofficially kicks off when major banks like JPMorgan Chase and Citigroup report their numbers. It creates a domino effect, setting the tone for other sectors.
Key Metrics to Watch in an Earnings Report
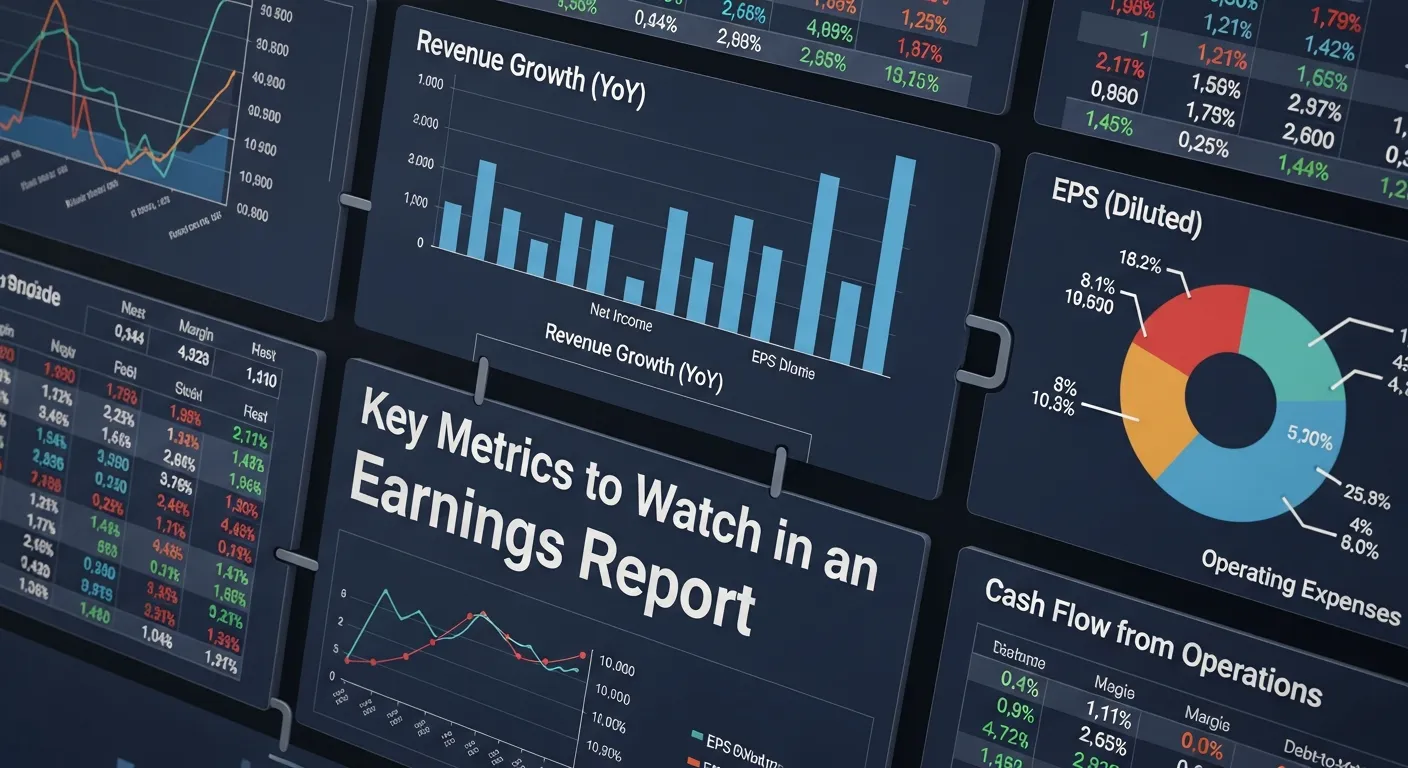

When a company releases its 10-Q or earnings press release, algorithms and analysts scour the document for specific numbers. To analyze these reports like a pro, you need to look beyond the headlines.
Earnings Per Share (EPS)
EPS is the portion of a company’s profit allocated to each outstanding share of common stock. It serves as a primary indicator of profitability.
- Beat: EPS is higher than analyst estimates.
- Miss: EPS is lower than analyst estimates.
- In-Line: EPS matches estimates.
Revenue (Top Line)
Revenue represents the total amount of money brought in by sales before expenses are deducted. A company might cut costs to boost EPS, but if revenue isn’t growing, the business may be stagnant.
Forward Guidance
This is often more important than past results. Guidance is the company’s own prediction of its future performance. A company might beat earnings expectations for the current quarter but lower its guidance for the next, causing the stock to plummet. This forward-looking statement is a critical component of Predictive Analytics in Trend Marketing and financial forecasting.
Net Income (Bottom Line)
This is the total profit after all expenses, taxes, and interest have been paid. It reveals the true efficiency of the company.
|
Metric |
What It Measures |
Why It Matters |
|---|---|---|
|
EPS |
Profit per share |
primary driver of stock price. |
|
Revenue |
Total sales |
Indicates demand and market share growth. |
|
Guidance |
Future outlook |
Influences future valuation and investor sentiment. |
|
Free Cash Flow |
Cash generated |
Shows ability to pay dividends, buy back stock, or reinvest. |
The Impact of Market Expectations
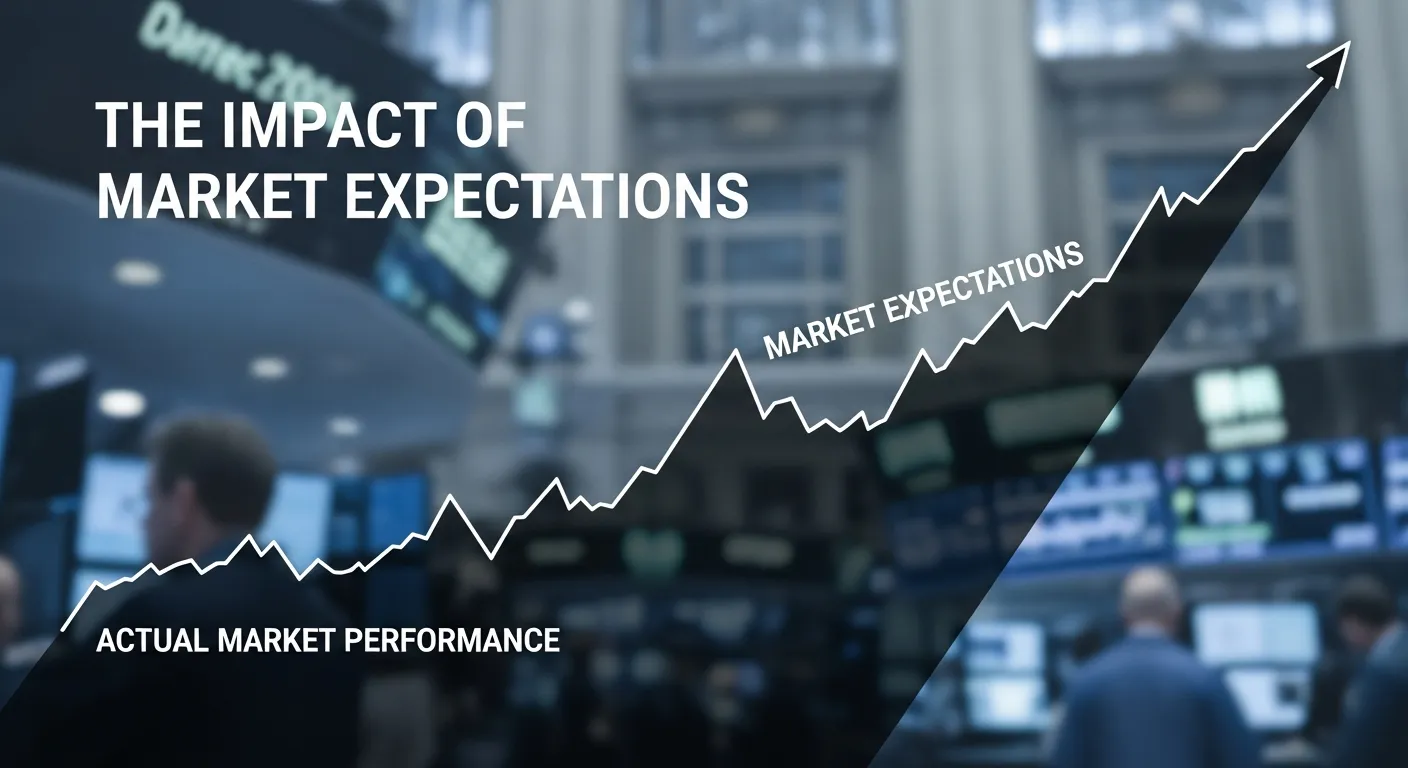
Stock prices are forward-looking mechanisms. They don’t just reflect what a company is worth today; they reflect what investors think it will be worth tomorrow. Therefore, the actual numbers in an earnings report matter less than how they compare to expectations.
The “Beat and Raise”
The holy grail of earnings season is the “beat and raise.” This happens when a company reports earnings and revenue that exceed analyst estimates and raises its guidance for the future. This usually triggers a rally.
The “Whisper Number”
Analyst estimates are public, but there is often a “whisper number”—the unofficial expectation among traders. If a company beats the official estimate but misses the whisper number, the stock might still sell off. Tools like SEMrush or Ahrefs can be used to track sentiment and search volume trends that might hint at these unofficial expectations.
Strategies for Trading and Investing During Earnings

Volatility spikes during earnings season. Here is how different types of market participants handle the heat.
The Long-Term Investor Approach
For long-term holders, earnings season is a time to verify your investment thesis.
- Don’t React to Headlines: A 5% drop on a “miss” might be an overreaction.
- Focus on Fundamentals: Is the company still growing? Is the competitive advantage (“moat”) intact?
- Listen to the Call: The earnings conference call often provides context that the numbers miss. Management might explain that a revenue miss was due to a temporary supply chain issue, not a lack of demand.
The Swing Trader Approach
Traders look to capitalize on the volatility.
- Pre-Earnings Run-Up: Buying stocks that show strong momentum weeks before the report, anticipating a “beat.”
- Post-Earnings Drift: If a company delivers a massive surprise, the stock price often continues to drift in that direction for weeks.
- The Straddle Strategy: Options traders might buy both a call and a put option, betting that the stock will move significantly in either direction.
Pro Tip: Never gamble on earnings. Analyzing historical volatility is safer than guessing a coin flip.
Sentiment Analysis and Alternative Data
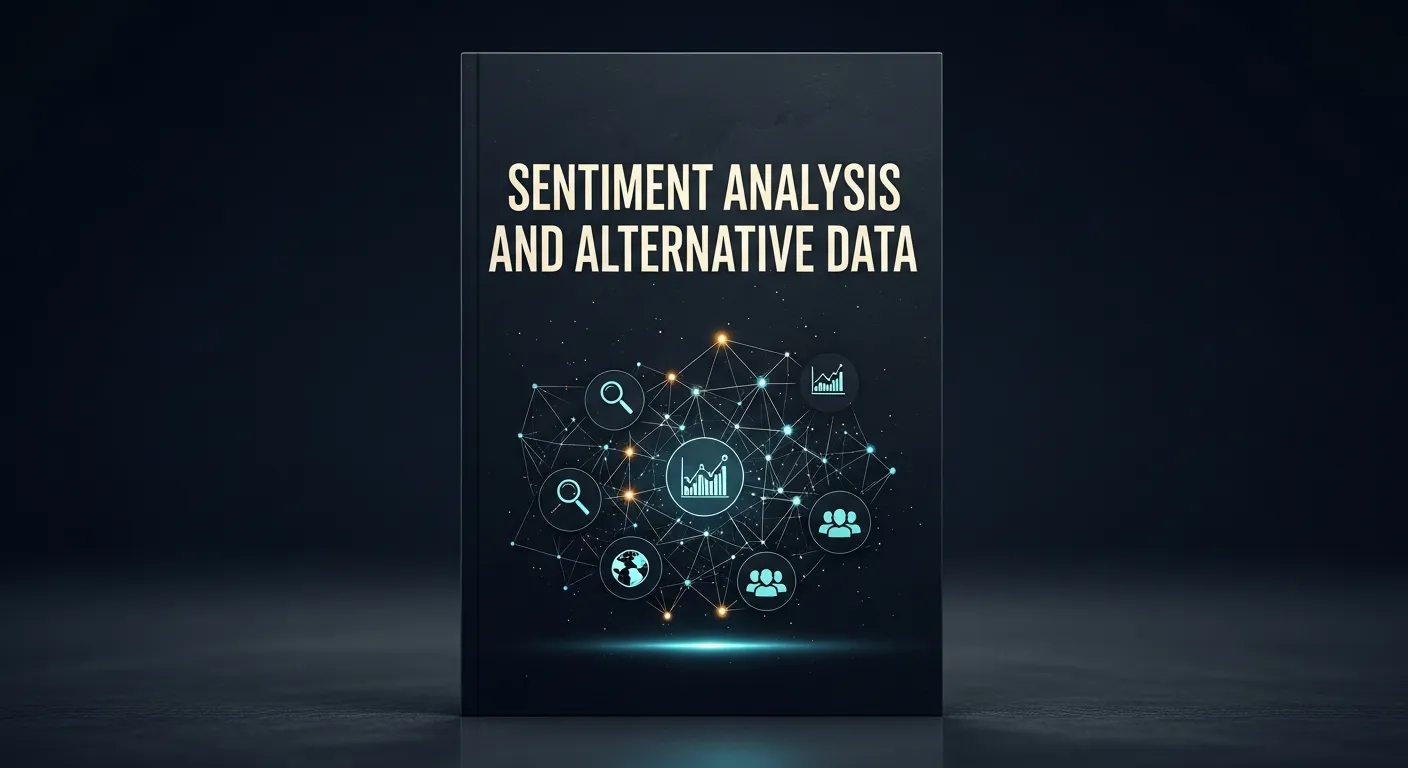
In the digital age, financial statements are just one piece of the puzzle. Sophisticated investors use alternative data to predict earnings surprises.
Digital Footprints
Investors analyze web traffic, app downloads, and social media mentions to gauge consumer demand before the official numbers drop. For example, a spike in search traffic for a retailer’s website might correlate with higher revenue. This aligns with strategies used in Predictive Analytics in Trend Marketing.
Social Sentiment
The Emotions affect consumer behavior and investor behavior alike. Platforms like StockTwits and Twitter can act as barometers for retail investor sentiment. If Social Media Viral Trends are favoring a specific brand’s product, it often translates to sales.
The Role of Branding in Financial Performance

A company’s brand strength is an intangible asset that directly impacts its bottom line. Strong brands have pricing power, meaning they can raise prices without losing customers. This resilience often shows up in earnings reports as stable margins during inflationary periods.
Brand Equity and Moats
Companies with high Brand Equity in Marketing (like Apple or Coca-Cola) are often less volatile during earnings season in the stock market. Their revenue streams are viewed as more predictable. Understanding What Is Brand Positioning Statement helps investors evaluate if a company is maintaining its competitive edge. If management deviates from their core identity, it can be a red flag.
Corporate Communication
How a CEO communicates bad news matters. Brand Crisis Management in the Social Media Era is critical. A transparent, confident explanation can soothe investors, while defensiveness can cause a sell-off. This is why Brand Voice Strategy extends beyond marketing and into investor relations.
Analyzing Different Sectors
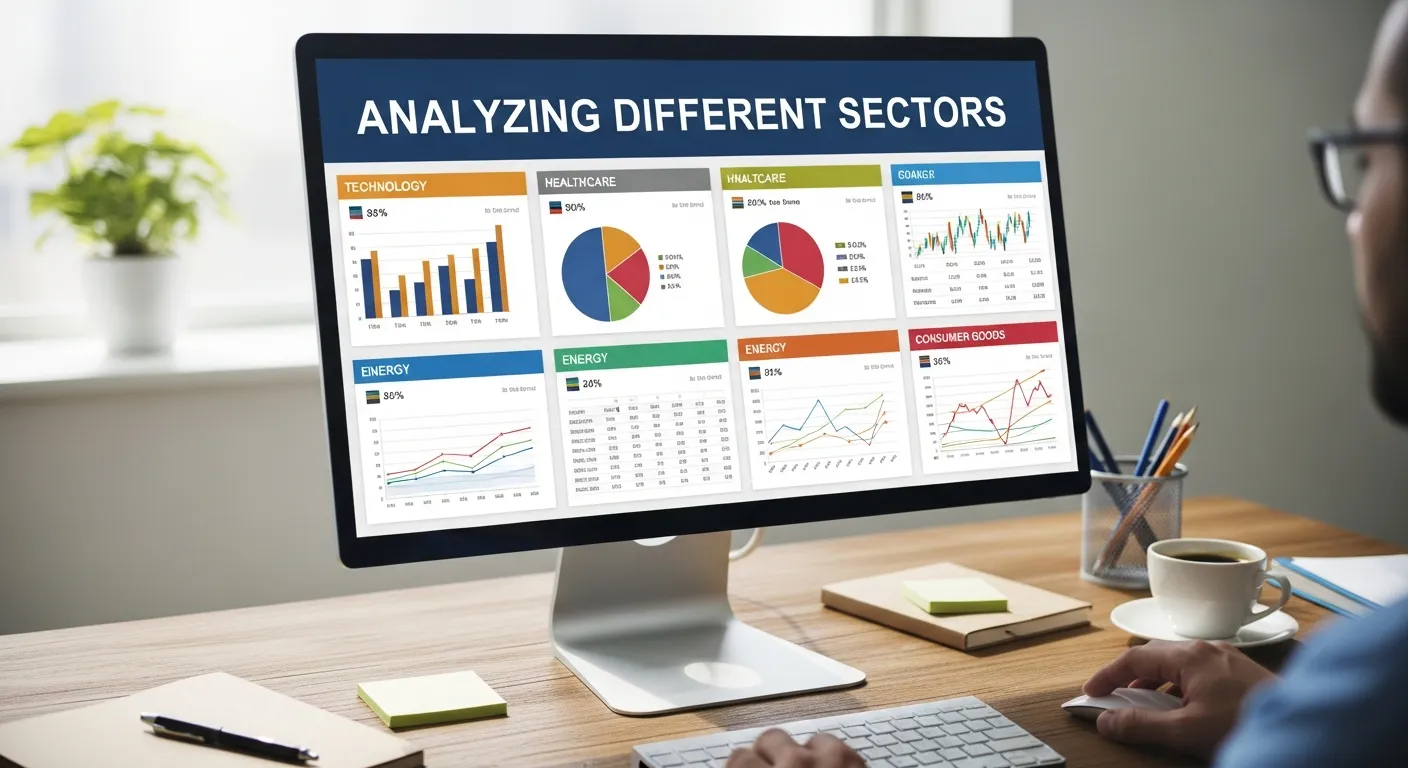
Not all earnings reports should be read the same way. Different sectors prioritize different metrics.
Technology and SaaS
For software companies, investors obsess over “Annual Recurring Revenue” (ARR) and “Churn Rate.” Profitability might be secondary to growth. Investors want to see that the company is capturing market share.
Key Question: Is the company growing its user base fast enough to justify its valuation?
Retail and Consumer Goods
Here, “Same-Store Sales” and inventory levels are king. If inventory is rising faster than sales, it suggests the company isn’t moving product and may have to discount heavily, hurting future margins.
Key Question: Is the company maintaining its pricing power?
Financials
For banks, “Net Interest Margin” and “Loan Loss Provisions” are critical. These metrics reveal the health of the broader economy.
Key Question: Is the bank preparing for a recession by setting aside more money for bad loans?
Common Mistakes to Avoid During Earnings Season
Even experienced investors make errors when emotions run high.
- Trading on the Headline Number: Algorithms react in milliseconds. By the time you read the headline, the easy money has been made. Dig deeper into the report.
- Ignoring the Macro Context: A company can report great numbers, but if the overall market is in a downtrend due to interest rate fears, the stock might still fall.
- Overlooking Stock-Based Compensation: Some tech companies show “adjusted” profits that exclude the massive amounts of stock they give employees. Always look at GAAP (Generally Accepted Accounting Principles) numbers for the full picture.
- Falling for Value Traps: A stock might look cheap after a post-earnings drop, but if the fundamental business model is broken, it’s a “value trap,” not a bargain.
- Neglecting Diversification: Betting the farm on a single earnings report is gambling. Ensure your portfolio is balanced.
Pro Tips for the Intelligent Investor
- Use an Earnings Calendar: Tools like Yahoo Finance or Benzinga provide calendars so you are never caught off guard.
- Listen to Competitors: If Pepsi reports weak earnings due to rising sugar costs, it is highly likely Coke will face the same issue. Use this cross-read to adjust your expectations.
- Watch the Reaction, Not Just the Result: Sometimes a stock rises on bad news because “it could have been worse.” This price action tells you that all the sellers are already out of the stock.
- Check Insider Activity: Did the CEO buy shares after the stock dropped on earnings? That is a massive vote of confidence.
How Marketing and Earnings Intersect
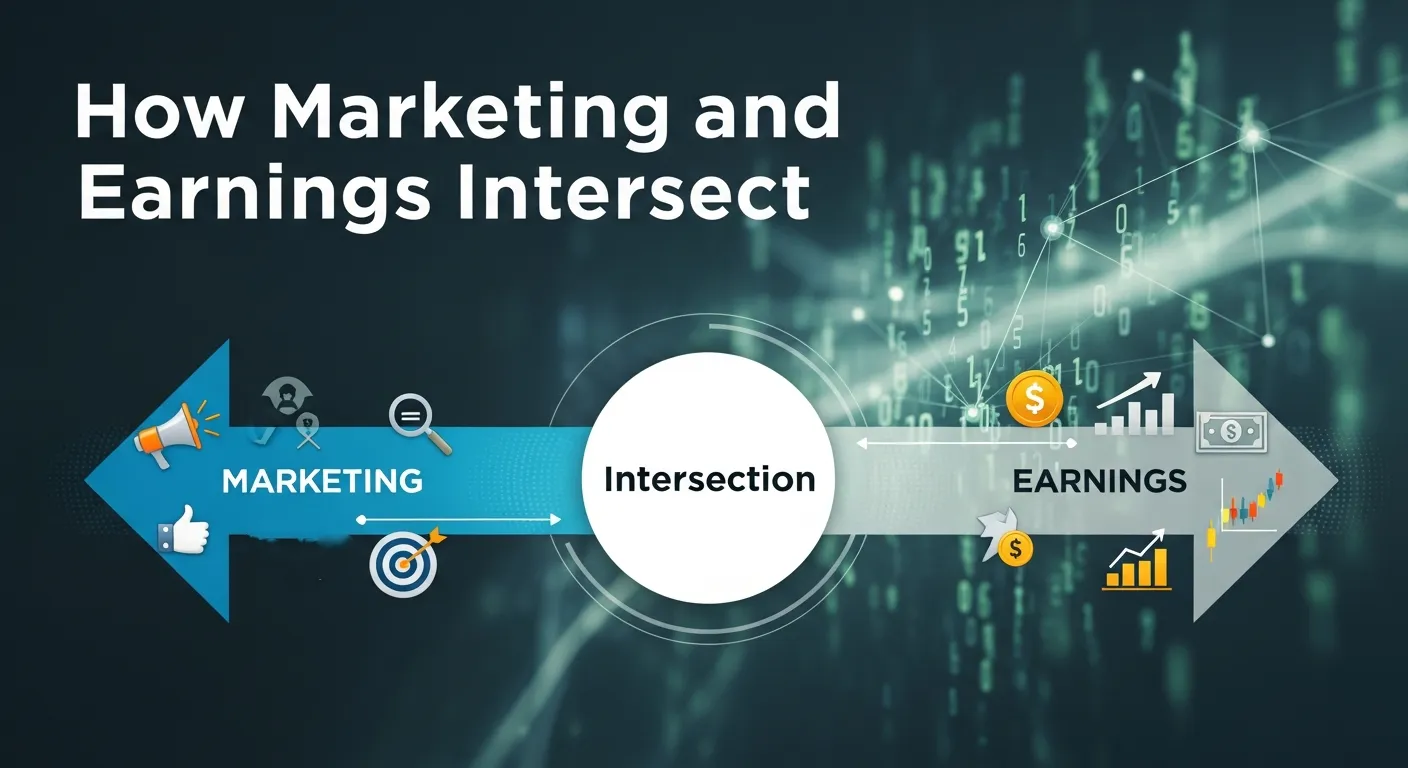
It is fascinating to see how marketing strategies influence financial results.
- Seasonal Campaigns: A well-executed holiday push, derived from knowing How to Plan a Winter Campaign, directly boosts Q4 revenue.
- Product Launches: Success in Using Influencer Marketing for Product Launches can lead to revenue beats in subsequent quarters.
- Customer Loyalty: High retention rates, driven by Emotional Branding, stabilize revenue and make earnings more predictable.
When you read an earnings transcript, look for mentions of marketing efficiency. Is the “Customer Acquisition Cost” (CAC) going down? That means their marketing team is doing a great job.
Comparison: Fundamental vs. Technical Analysis During Earnings
|
Feature |
Fundamental Analysis |
Technical Analysis |
|---|---|---|
|
Focus |
Financial health, revenue, EPS, guidance. |
Price action, volume, charts, trends. |
|
Time Horizon |
Long-term investment. |
Short-term trade. |
|
Earnings Strategy |
Buy undervalued companies with strong growth. |
Trade the breakout or breakdown after the news. |
|
Risk |
Valuation compression. |
False breakouts / Whipsaws. |
Conclusion
Navigating earnings season in the stock market requires a blend of financial literacy, emotional discipline, and strategic foresight. It is the quarterly report card that keeps the market honest. By focusing on key metrics like EPS and guidance, understanding market expectations, and ignoring the noise, you can protect your capital and uncover significant growth opportunities.
Whether you are analyzing a tech giant or a Seasonal Marketing play, the principles remain the same: data drives decisions. Don’t just watch the stock ticker; read the story behind the numbers.
FAQs: Earnings Season in the Stock Market
1. How long does earnings season last?
Earnings season typically lasts about six weeks each quarter. It starts roughly two weeks after the quarter ends. The busiest weeks usually fall in the middle of this period, often referred to as “peak earnings,” where hundreds of companies may report in a single week.
2. Why do stock prices drop even after beating earnings estimates?
This phenomenon is common and often confusing. It usually happens for three reasons:
- Weak Guidance: The past was good, but the company warned the future looks difficult.
- Profit Taking: Traders who bought the rumor sell the news to lock in gains.
- Valuation: The stock was already priced for perfection, and the “beat” wasn’t big enough to justify a higher price.
3. Should I sell my stocks before earnings season starts?
Not necessarily. If you are a long-term investor, selling before every earnings report triggers tax events and incurs transaction costs. However, if a position has become too large a part of your portfolio, trimming it before a volatile event can be a prudent risk management strategy.
4. Where can I find earnings calendars?
You can find reliable earnings calendars on major financial news websites like Bloomberg, CNBC, Yahoo Finance, and investing platforms like Investing.com. Your brokerage account will also likely provide a calendar for the stocks you hold.
5. What is the difference between top-line and bottom-line growth?
“Top-line” refers to revenue or gross sales—the money coming in at the top of the income statement. “Bottom-line” refers to net income or earnings per share—the profit left over at the bottom of the statement after all expenses. A company can grow its bottom line by cutting costs, even if its top line (sales) is flat.
6. How does earnings season affect the broader stock market?
Earnings season acts as a reality check for the entire market. If bellwether companies (industry leaders) report strong earnings, it generally boosts investor confidence and lifts the major indices like the S&P 500. Conversely, widespread disappointments can trigger a market correction.
7. What is an earnings call?
An earnings call is a conference call between the company’s management (CEO, CFO) and investment analysts. They discuss the financial results and answer questions. These calls are public, and listening to them can provide crucial insights into management’s tone and confidence that you won’t find in the spreadsheet.
8. Can I trade earnings after hours?
Yes, most earnings reports are released before the market opens or after the market closes. You can trade during these “extended hours” sessions, but be aware that liquidity is lower and volatility is significantly higher. The spread between the bid and ask price can be very wide.
9. What does “priced in” mean?
“Priced in” means the market has already anticipated a certain outcome and adjusted the stock price accordingly. If everyone expects a company to report amazing numbers, the stock price likely rose before the report. When the news hits, the stock might not move much because the event was already “priced in.”
10. How do seasonal trends affect earnings?
Seasonality is huge. Retailers typically make the bulk of their profit in Q4 (holiday season). Construction companies might be busier in summer. Understanding What is Seasonality in Marketing and operations helps you adjust your expectations. You wouldn’t compare a retailer’s Q1 (slow season) directly to their Q4 (peak season) without adjusting for seasonality.